
Three hands-on ways I turn messy signals into a clean trend call: cohort pivots, search deltas, and a regret-proof dashboard.
Cohort pivots beat vibe checks every time
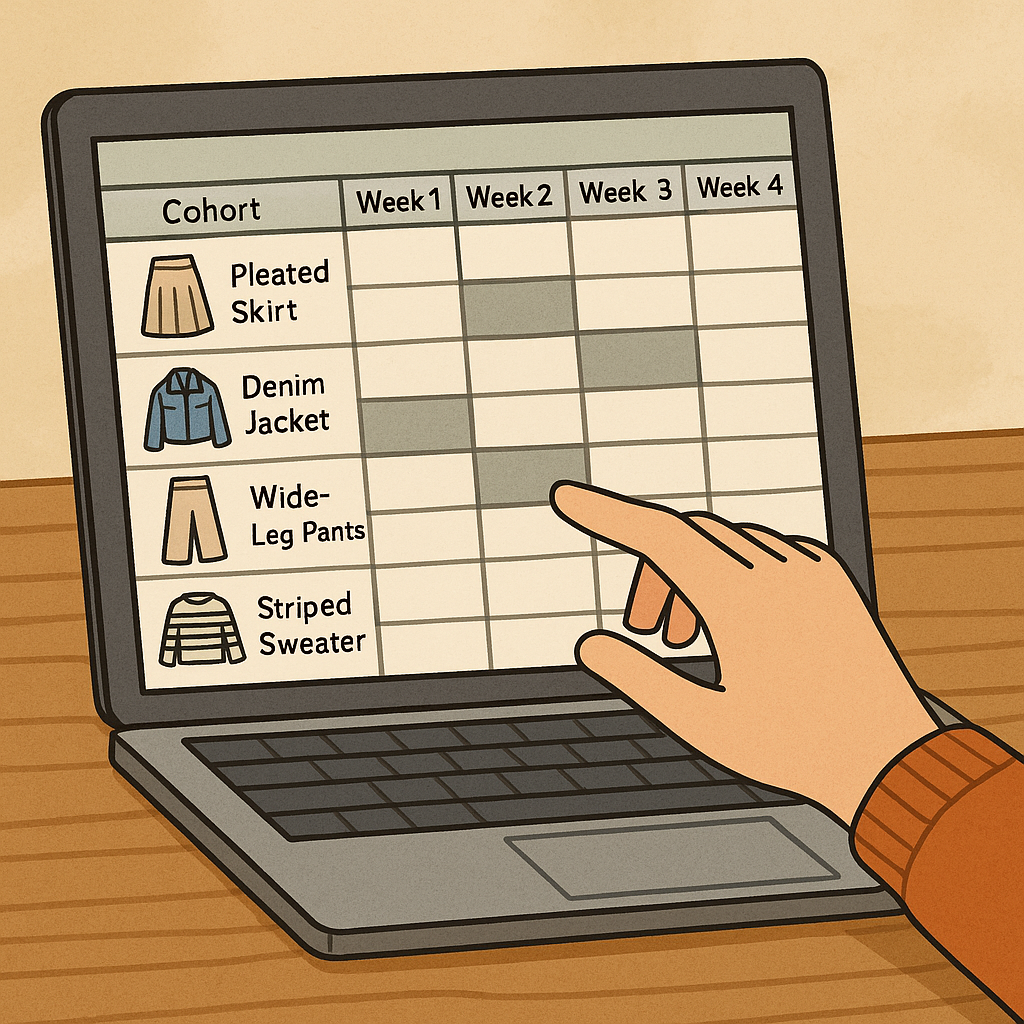
I used to keep a running Notes app list of stuff I saw three times in a week. It felt productive. It also lied to me, because my feed is not a random sample. The first switch that made trend calls feel less like a mood and more like a method was a cohort pivot. Nothing fancy: I dump my own touchpoints (saved posts, product pages I clicked, carts I abandoned, stuff I tried on and returned) into a spreadsheet, then slice it by week and by the first date I noticed the item. That first-seen date becomes the cohort.
Here’s what I’m looking for: do later weeks behave differently than the early adopters? If a silhouette is sticking, the “first saw it last week” group starts acting like the “first saw it last month” group. They don’t just look, they do. Saves turn into clicks, clicks turn into add-to-carts, and add-to-carts turn into purchases, or at least a second session on the same product page. When it’s a mirage, the curve is spiky: big save week, dead the next, then a random blip when a creator posts the same outfit formula again.
Practical detail that matters: I don’t track individual influencers as categories. I track the object. “Barrel-leg jean” and “pleated short” get their own row, and I’ll add a qualifier only when it changes behavior (like “low-rise barrel” vs “mid-rise barrel”). If you keep it too broad, you can’t tell whether the rise or the leg shape is doing the work. And yes, I still look at the clothes. The pivot just decides which rabbit hole is worth trying on in a fitting room versus leaving as a screenshot fantasy.
Watch the search phrasing, not the keyword volume
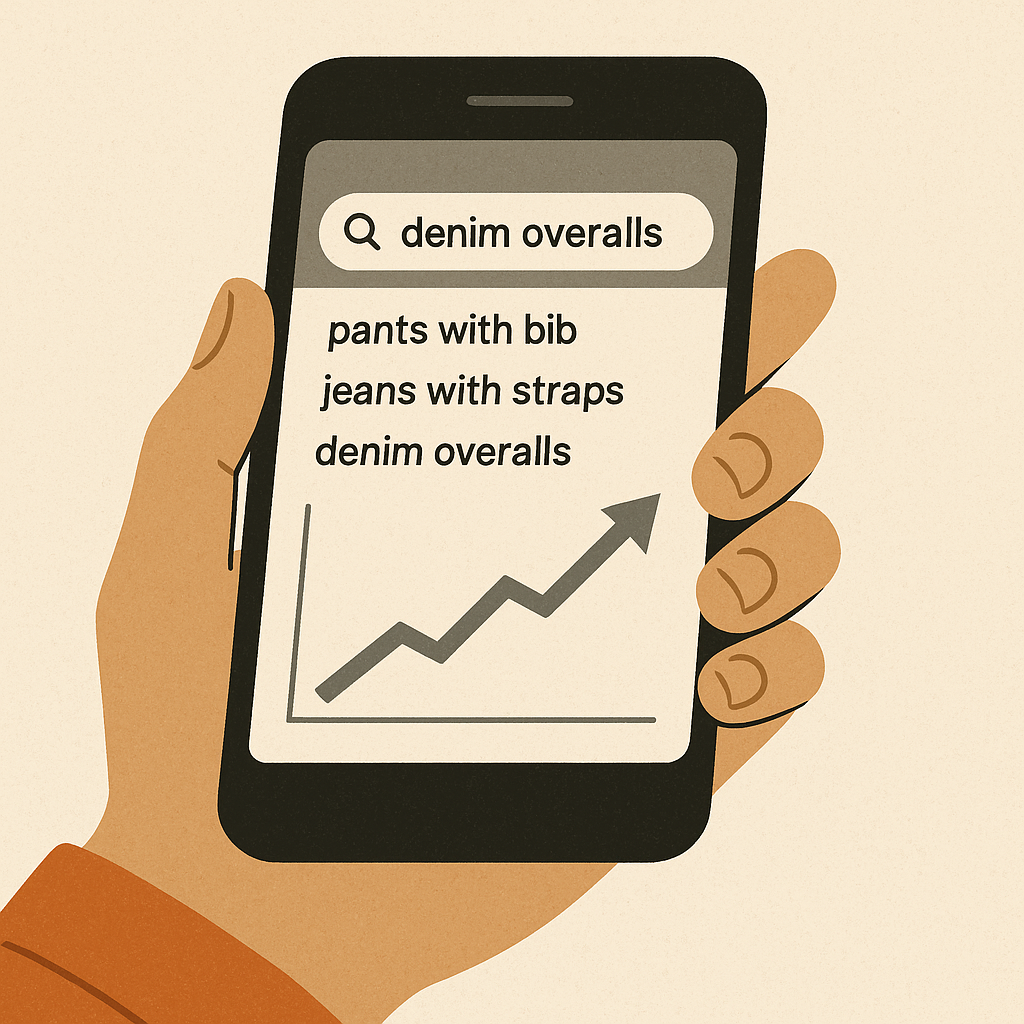
Search data can be noisy, and I learned that the hard way. If you chase raw volume, you end up late, buying the thing when every size is gone and the dupes are already on their third restock. What I watch now is phrasing drift. People don’t wake up and suddenly type a brand-new microtrend name. They start by describing a problem, then a detail, then (eventually) they use the accepted label.
So I’ll pull a short list of queries from whatever tools I have access to that week (Google Trends, Pinterest Trends, a marketplace autocomplete scrape, even my own site search if I’m running a shop page). Then I categorize them by intent, not by noun. Three buckets that keep me honest:
- Problem searches: “jeans that don’t gap at waist,” “shoes for wide toe box,” “tank that hides bra.”
- Detail searches: “seam down the front pants,” “square-toe slingback,” “sheer long sleeve layering.”
- Name searches: the shorthand label that makes it into captions and product titles.
When I see detail searches climb while problem searches stay steady, that’s the signal. It means shoppers have stopped asking for a fix and started shopping a look. That’s when I’ll test one item in person, usually from a brand I already know for predictable sizing (Levi’s for denim experiments, Adidas or New Balance when sneakers are the signal, Uniqlo for basics when the styling is the point). I’m not pretending this “proves” anything, it just keeps me from building a forecast off a single graph.
One more thing that feels minor but isn’t: watch for material words entering the chat. The week people add “linen,” “poplin,” “mesh,” or “lamé” to an otherwise stable query, it usually maps to what’s showing up in photos. You can feel the season shift in the search bar before you can in your closet.
Build a dashboard that punishes your bad habits
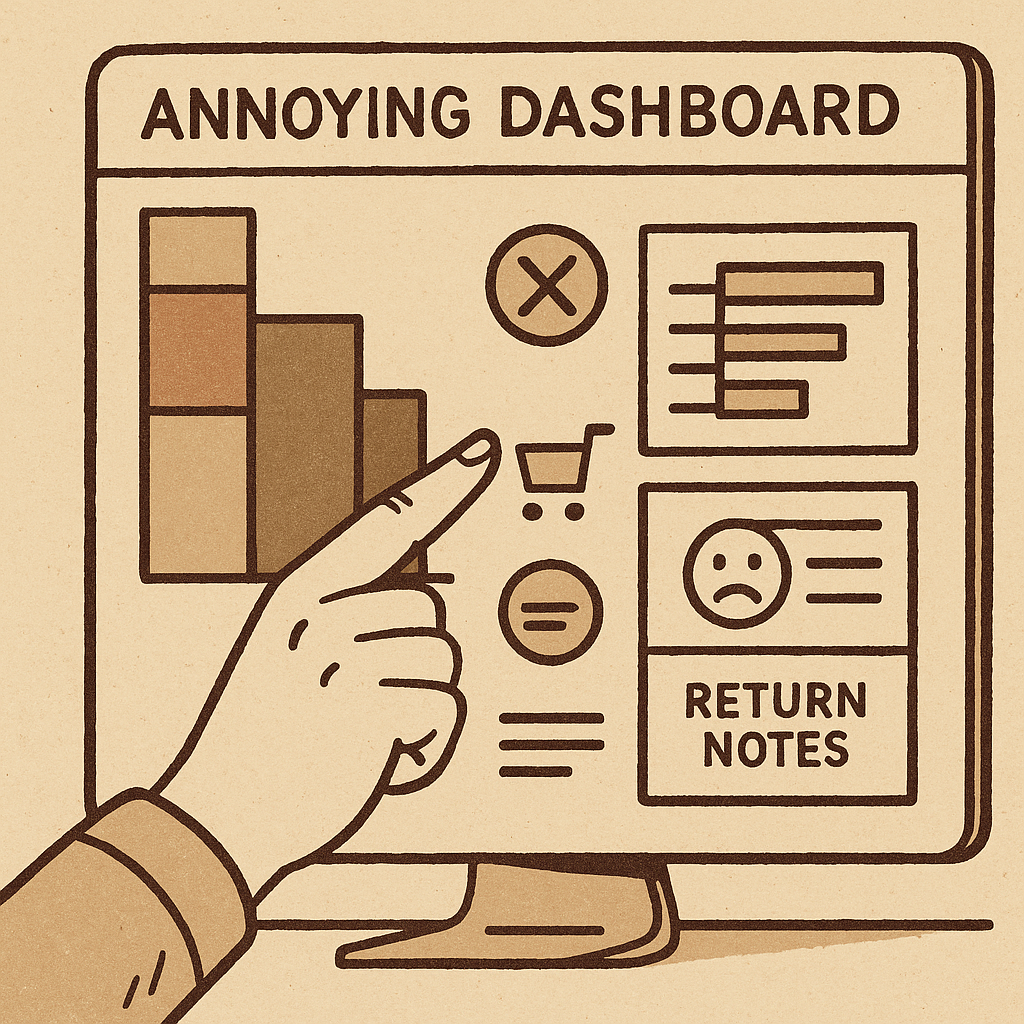
I’m not a “10 tabs and a Notion temple” person. If I can’t see the story on one screen, I won’t check it consistently, and then I’ll be right back to gut-feel forecasting. The dashboard I keep is intentionally annoying. It highlights my worst impulses: over-weighting one creator, confusing try-on content with buying behavior, and mistaking my own taste for market direction.
Here’s what’s on it, and why each tile earns its spot:
- Signal mix: a simple stacked bar that shows where my mentions come from (Instagram saves, TikTok shares, retailer new-arrivals, resale listings). If one source dominates, I’m probably in an algorithm bubble.
- Repeat sightings per item: not total sightings, repeat sightings by distinct days. I want the thing that shows up five separate days, not ten times in one doomscroll.
- Conversion proxy: I track “actions with friction” like adding to cart, wishlisting, or clicking size charts. Likes are free. Size charts mean someone’s imagining ownership.
- Return notes: when I buy test pieces, I log why I kept or returned them (fabric felt flimsy, rise sat weird, color looked different in daylight). Those notes are trend forecasting gold because they explain why something stalls.
Then I add one constraint: every item needs two kinds of evidence before I treat it as a trend worth writing about or shopping around. One has to be behavioral (cart adds, resale velocity, repeat search phrasing), and one has to be visual (lookbooks, street style, brand merchandising). If I can’t meet that bar, I’m allowed to like it. I’m just not allowed to call it “next.”